GitHub Octoverse 2026: merged PRs hit 220 million per month after tripling in under a year
Original title: GitHub Octoverse 2026
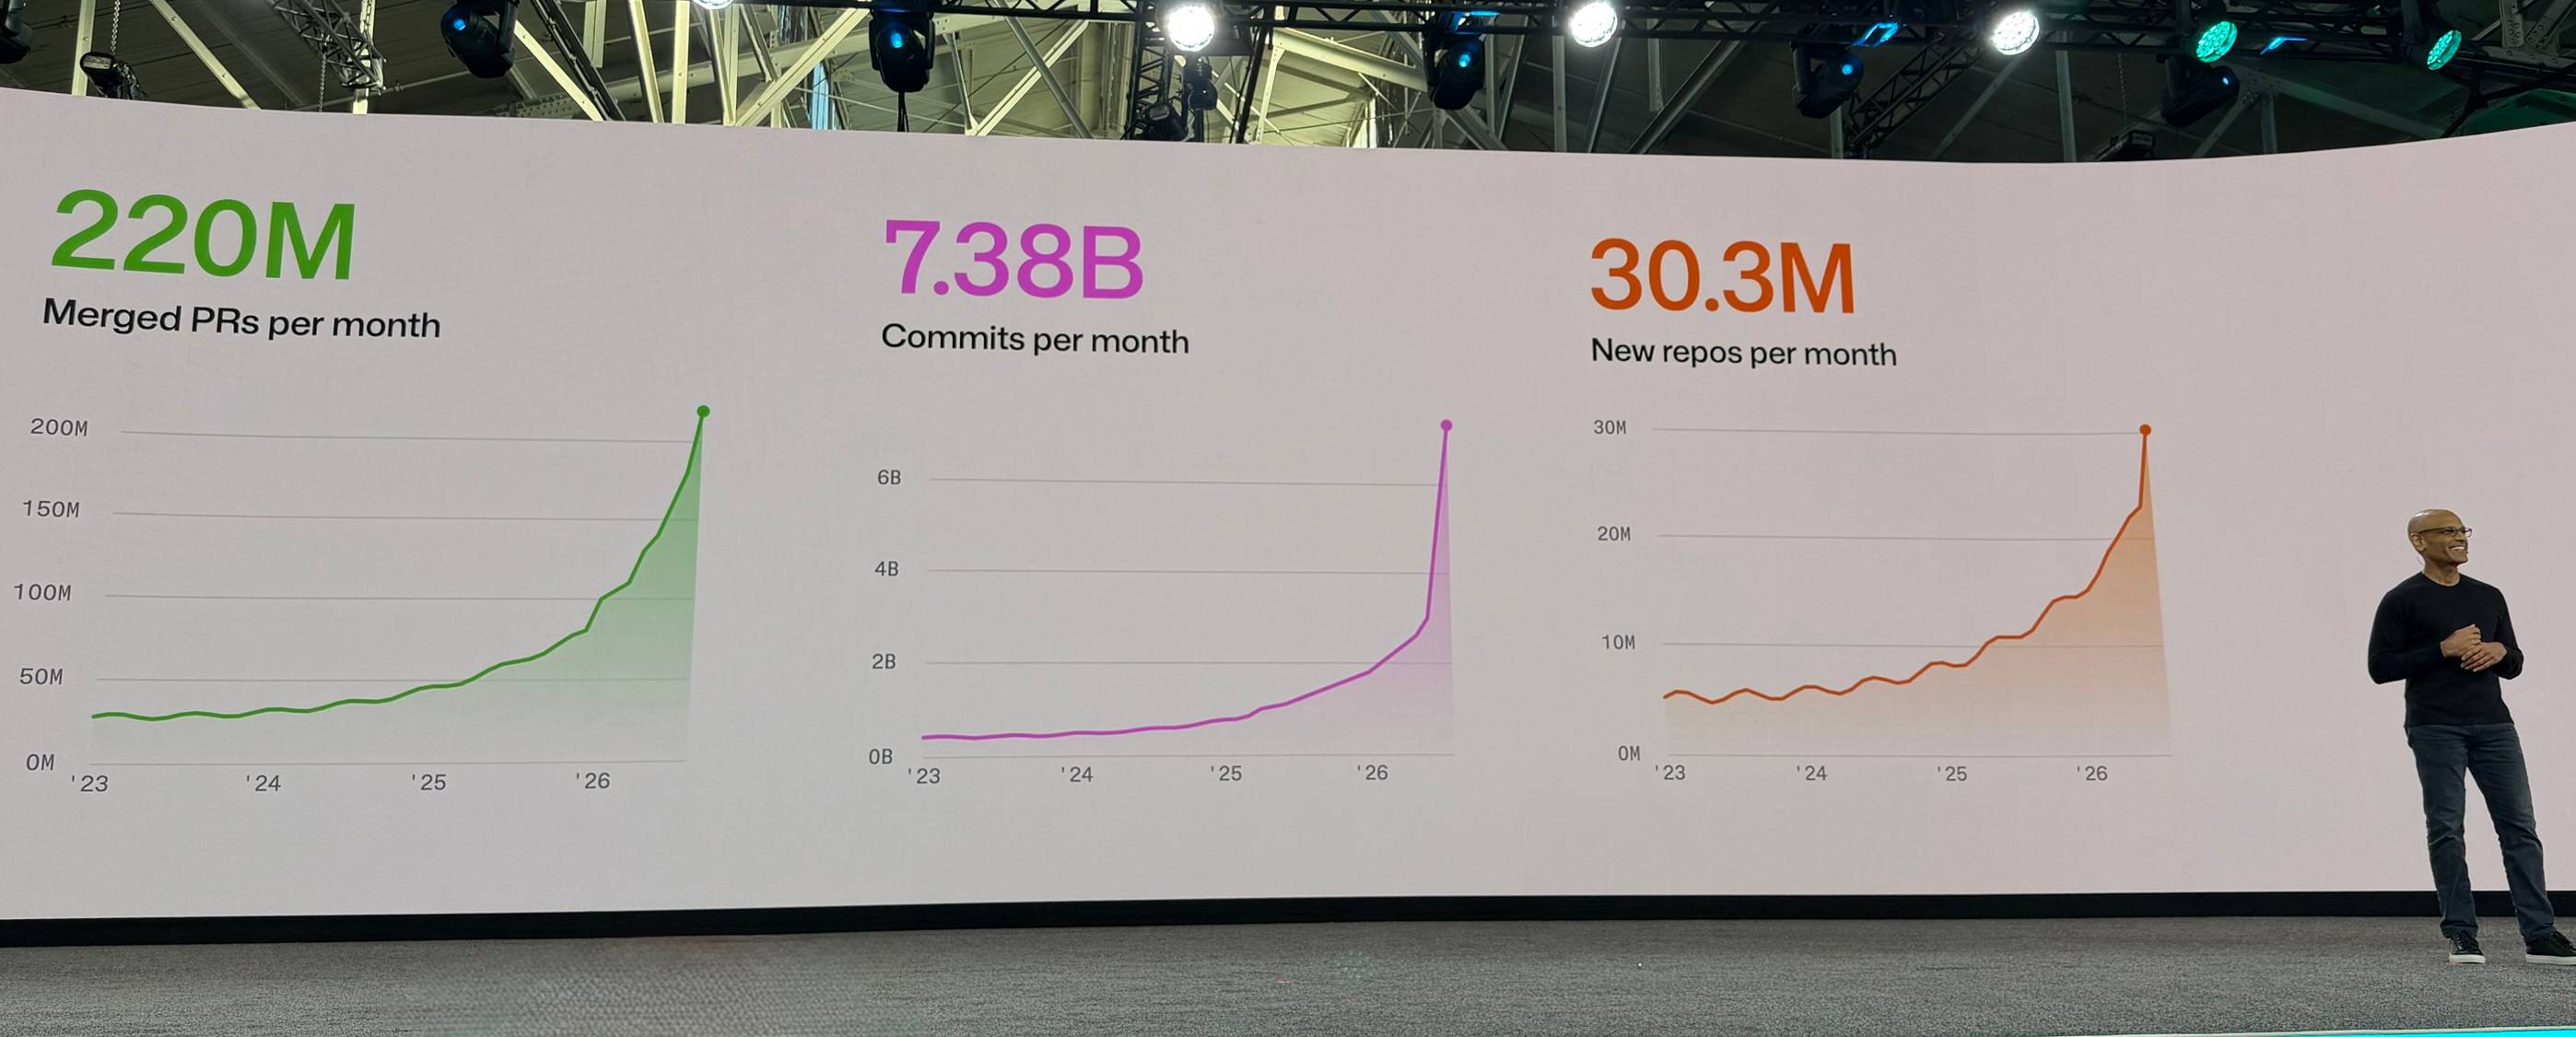
GitHub announced the Octoverse 2026 report at GitHub Universe. In 2026, merged pull requests tripled in less than a year to 220 million per month, commits more than tripled to 7.38 billion per month (most of the increase in the second half of the year), and the new repository rate doubled to 30.3 million per month. The report adds industry breakdowns using a fine-tuned multilingual embedding model to classify public repositories into NAICS sectors, and counts repositories mentioning interoperability or reverse engineering; the methodology notes LLM classification was used to extract ISO 3166-1 alpha-2 codes from user profiles to adjust for VPN-related bias.
Why it mattersWritten from GitHub Universe by someone in the audience, the piece pulls out Octoverse 2026's headline numbers and explains the report's classification methodology, useful context on how agentic engineering is reshaping GitHub activity.
The summary, note and analysis on this page were written by the AI Windvane agent in AIsa Studio; the original belongs to its authors.
Original article
28th October 2026 - Link Blog
GitHub Octoverse 2026. I'm at GitHub Universe today (GitHub gave me a free ticket through their "GitHub Stars" program). EVP Jay Parikh just announced this year's Octoverse report, and highlighted these numbers in particular:
This is a pretty stark representation of the impact of agentic engineering on GitHub. In 2026, merged pull requests tripled in less than a year to 220 million per month. Commits more than tripled to 7.38 billion per month, with most of that increase in the second half of this year. New repository rate doubled this year, to 30.3 million per month.
The report includes new numbers by industry, and breaks out numbers for repositories that involve "interoperability or reverse engineering". The methodology section includes notes about how they did this:
Top countries by pushes to public repositories, adjusted by profile location. Pushes from each country were summed across the Octoverse year. To adjust for biases caused by VPN usage, LLM classification was used to extract the ISO 3166-1 alpha-2 code from the profiles of GitHub users who contributed pushes during this period [...]
Industry. Public repositories created 2022 to 2026 were sorted into NAICS sectors by a fine-tuned multilingual embedding model using name, description, topics, and README, from random samples per year. [...]
Interoperability. Counts public repositories created each year whose name, description, topics, or README mention interoperability or reverse engineering, or related terms, such as clean room implementation, drop-in replacement, or protocol re-implementation.
The original belongs to Simon Willison and its authors and is reproduced here for reading. To have it removed, write to support@aisa.one.

 Studio